![]()
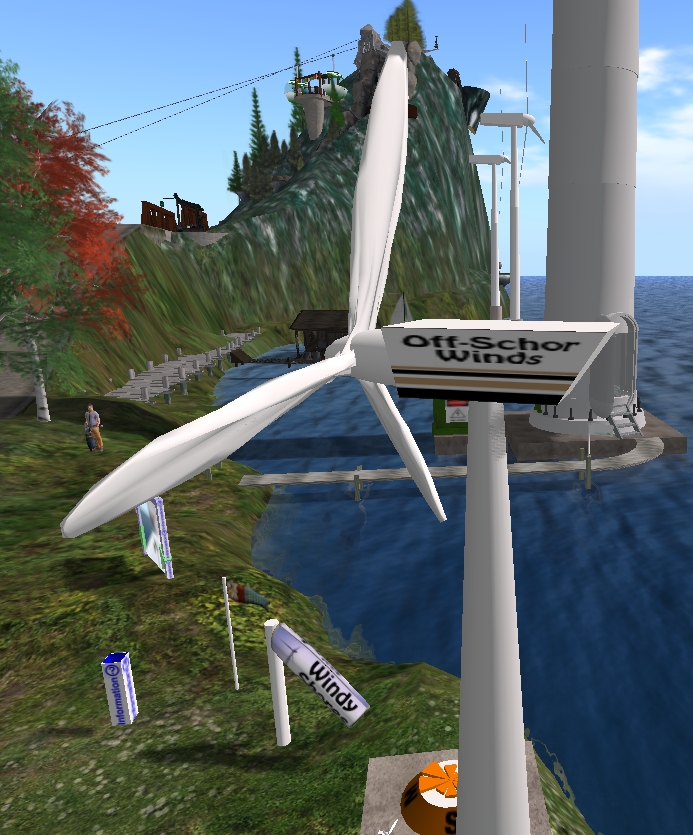
A few days ago, the Science Circle led a field trip to the Sustainable Energy Science Lab on Etopia Island. The tour was led by Windy Schor (Shawn Reeves from EnergyTeachers.org in RL). On Etopia Island Windy Schor, and her colleague Solar Sierra, have developed examples of how to generate and use electricity from renewable wind and solar sources. They have many interesting exhibits and one small component caught my eye. It was a wind rose that is used to display the prevailing winds at a particular place (See picture below).
 Windy Schor explains, “This wind rose is a bar graph, showing how often the wind blows in each direction. Think of each wedge as an arrow, with it’s tip (the point in the center of the circle) pointing in the same direction as the wind is blowing. Every 5 seconds (or whatever the programmed interval), this object measures the wind speed and direction where it sits, and adds to a bin for the current direction. The size of each arrow is proportional to the number of measurements in the relevant bin divided by the maximum number of all bins, so that the most common direction always shows as a full size arrow.”
I am most interested in the details of how scientists create the tools they use in their work. The wind rose object in SL provides information on the relative wind direction. People who use a wind rose for flying, sailing or setting up wind turbines need more detailed information. I asked Schor how she programmed a more informative version.
“At any given time, and any given location in a region, SL provides a wind vector which represents the direction and speed of the wind there. The vector is the same along any vertical column, so only the east-west and north-south components of the 3-D vector matter. The vertical component is always zero, so the wind doesn’t blow up or down.
“For example, at location 230,68,27 in a region called “Etopia Island”, we find that the wind vector is <1.2, 0.0, 0.0>. That means that the wind is blowing 1.2 meters per second directly towards the east. A more detailed discussion of wind vectors is at the end of this article. With a script running in an object in the place where we want to measure the wind, we can periodically get that vector and use it or store it.
“To program objects in SL, we have to use Linden Scripting Language (LSL). This language is good for watching SL-type events that happen to objects, like touches or chatting or physical interactions with the environment, land, and other objects. In a LSL script, we can also call web sites and send/receive information to/from web servers. The web server for EnergyTeachers.org (ETO) will respond to calls from our anemometers in SL.
“The anemometer has a script written in LSL which runs a timer. Every 30 seconds, the timer fires, and that runs a sub-script which measures the wind (gets the wind vector from the region’s simulator) then sends that vector with a timestamp to the server at ETO.
“The ETO server uses the PHP language to gather, store, and interpret data from our anemometers. A PHP script takes the message from SL; makes sure it is in the format it expects, a timestamp and a vector and a location; calls our database (MySQL), and requests to store the information in the database.
 “PHP has libraries to make scaled-vector graphics (SVG) and portable network graphics (PNG) images. To make a graph, our PHP script asks our MySQL database for the wind information in the form it needs, then arranges the info for the graph. Two graphs, one in SVG and one in PNG, look similar, and the scripts for making them are similar except that the command for making a line in SVG is different from that for making a line in PNG. The same numbers go in, but the commands look different. (See wind rose graphic on right. Click on the image to see it full size)
“So, to follow the entire path of information into the server, one must study LSL, PHP and MySQL.
“To produce graphics directly in SL, without being able to store every vector, such as it is with our Wind Rose [object shown above] , requires statistical tricks. For example, our wind rose shows how often the wind blows in each direction. Instead of storing the vector, which requires several bytes of information, we just decide which of eight directions that vector is, say “directly east,” and increase the count of times that the wind has blown “directly east,” then throw away the vector. That counting variable just requires four bytes, and we just have eight directions, so the storage for the whole graph is just 32 bytes.
“Aviators like wind roses, which tell how the wind typically blows at an airport, so they know how best to approach the airport. We can make custom wind roses for each hour of the day, so aviators can know that it’s best to approach an airport in the morning from such an angle, but better from another angle in the evening. That is very common for airports near the ocean.”
Resources and References
- Sustainable Energy Science Lab on Etopia Island.
- Field trip by the Science Circle to the Sustainable Energy Science Lab – https://www.sciencecircle.org/event/sustainable-energy/
- See data from SL and from RL and create wind roses from that data at Energy Teachers.
- LSL Portal.
- PHP scripting language, Wikipedia.
- MySQL database management system, Wikipedia.
- Python Wind Rose Charts, Plotly: Graphing Libraries. “We only recently found out about Plotly,” said Schor. “We made our own in PHP, but recommend libraries like Plotly for people who are starting from scratch, or people who would like to learn Plotly and then use it for all other sorts of analytical fun.”
- The wind speed vector is three numbers, <vx,vy,vz>, all in meters per second.
- vx is positive for east, negative for west.
- vy is positive for north, negative for south.
- vz is positive for up, although in SL it is always zero.
Thus, a 2.1m/s wind blowing toward the east is <2.1,0.0,0.0> and a 2.1m/s wind towards the south is <0.0,-2.1,0.0>. It get s more complicated for quartering winds. Thus, a wind towards the northwest of 2.1m/s is <-1.5,1.5,0.0>. Why 1.5? That’s because the wind vector is coming from two directions and is calculated by 2.1=√(-1.5²+(1.5)²).
 |
| Visits: 1623284 |