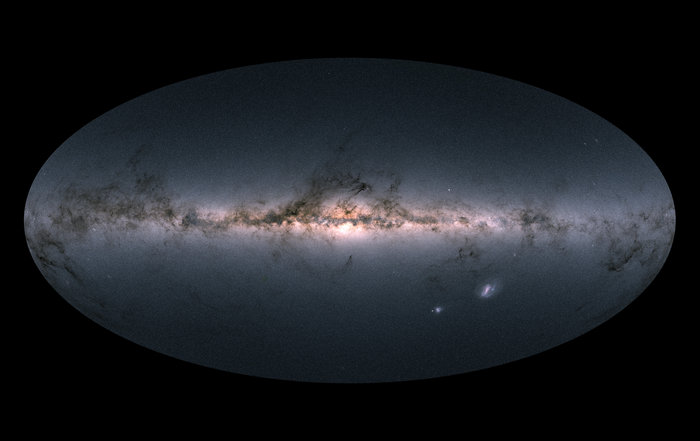
Gaia’s all-sky view of our Milky Way Galaxy and neighbouring galaxies, based on measurements of nearly 1.7 billion stars. The map shows the total brightness and colour of stars observed by the ESA satellite in each portion of the sky between July 2014 and May 2016.
Brighter regions indicate denser concentrations of especially bright stars, while darker regions correspond to patches of the sky where fewer bright stars are observed. The colour representation is obtained by combining the total amount of light with the amount of blue and red light recorded by Gaia in each patch of the sky. Read more…